
Investigations
Note
Investigations is currently in public preview. Grafana Labs offers limited support, and breaking changes might occur prior to the feature being made generally available. We’d love to hear about your experience so we can keep improving the app. To provide feedback, complete this form.
An investigation is a group of items collected from the Grafana Drilldown apps.
With Investigations you can:
- Collect metrics, logs, traces and profiles, and annotate them to explain their significance.
- Quickly navigate between the various signals without opening several browser tabs.
- View the items at different time ranges to quickly analyze recurring issues.
- Create a dashboard from an investigation.

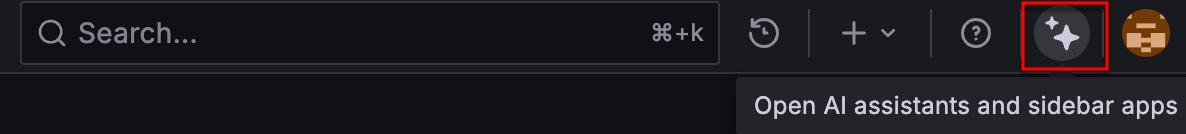
To access Investigations, click the Open AI assistants and sidebar apps (sparkle) icon in the top-right corner of Grafana:
Each investigation includes visualizations from items you’ve added to it as well as links from any other pages you’ve added to the investigation. The following image shows two items and one link:

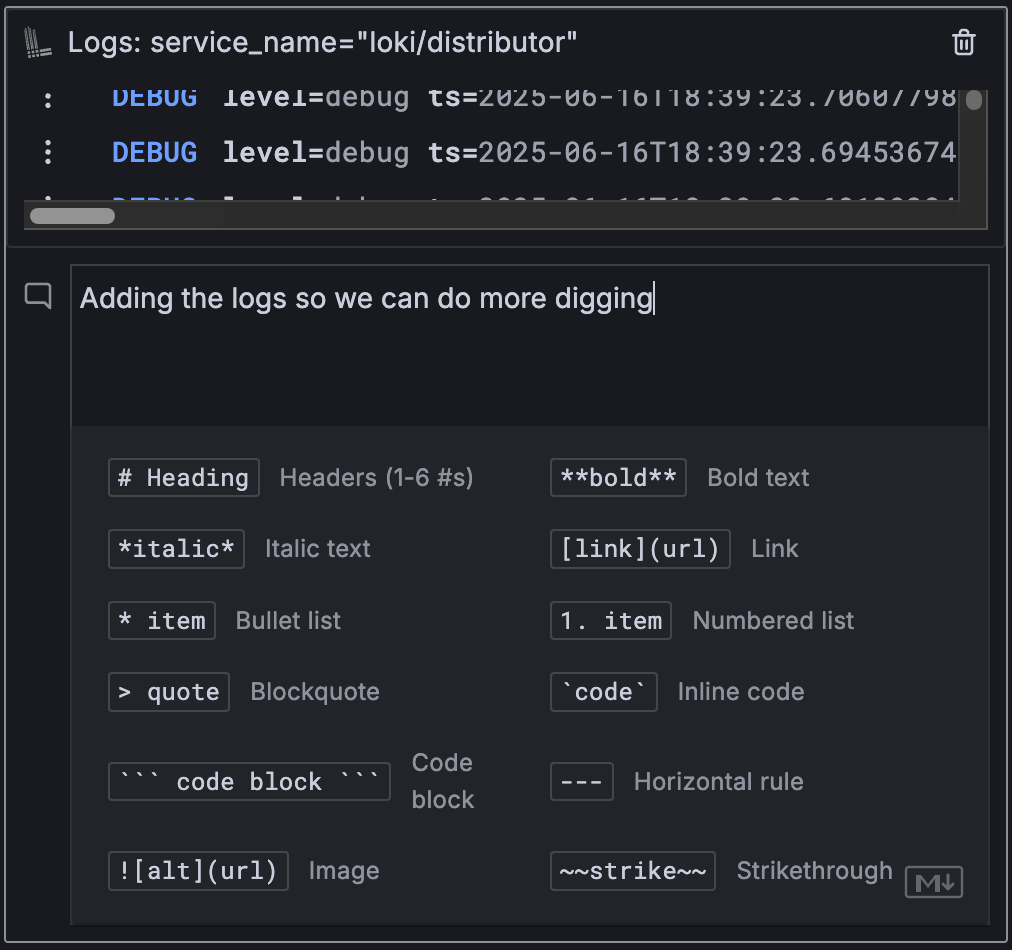
You can add comments for any item or link as well as for the entire investigation. All of these fields support Markdown and for help, you can click the Markdown icon to open a cheat sheet:
In the top-right corner of the investigation, you can click the menu icon (three dots) to access the following further actions:
- Toggle between Compact view and expanded view (expanded view shows taller graphs).
- Toggle the Show all tooltips switch on and off. When the switch is on, a tooltip with additional details is displayed when you hover your cursor over a shared point on a graph.
- Open the Compare time ranges view in a new browser tab.
- Open the Timeline view in a new browser tab.
- Create a dashboard from the investigation (this opens in a new browser tab).
- Declare an incident from the investigation.
- Delete the investigation.

Click the star at the top-right corner of an investigation to mark an investigation as a favorite and have it displayed at the top of the list.
Investigation items
An investigation item is made up of:
- A visualization of the data you added from the Drilldown app. The icon in the top-left corner of the item shows you the source of the item.
- Comments you’ve added. These let you keep track of insights along the way and they show up in other visualizations.
The item name appears as the title. You can click this to navigate back to the source app.

Sidebar view
The Investigations sidebar is the main way to interact with investigations. It displays a list of your past investigations and those created by others. It’s also where you can create new ones. Starred investigations appear at the top of the list.

Timeline view
The Timeline view shows investigation items relative to each other on a full page. The timeline also helps you see when events occurred. It also extends the data beyond the specific time range to help you see what the data was doing before and after.

Comments are included, so you can see the complete story all at once.
Clicking the eye icon in the top-right corner of each item expands it. This lets you see the data in maximum detail and allows you to edit the comments.
Was this page helpful?
Related resources from Grafana Labs


