

What’s new in Grafana Metrics Drilldown: advanced filtering options, UI enhancements, and more
Grafana Metrics Drilldown offers a queryless experience for browsing Prometheus-compatible metrics. With Metrics Drilldown — which is part of our suite of Grafana Drilldown apps — you can quickly find related metrics with just a few simple clicks, no PromQL queries required.
Since launching Metrics Drilldown one year ago, we’ve been hard at work, adding new features and UI enhancements that make it even easier for you to navigate vast amounts of data and quickly pinpoint the metrics that matter most.
At GrafanaCON 2025 earlier this month, we highlighted some of these recent updates to Metrics Drilldown. Here, we’ll take a closer look at what’s new, and how you can use these features to narrow down your metrics volume (and more) with just a few simple clicks. You can also see a demo of these new features in the video below.
Find key metrics faster with the sidebar menu and filters
First, we’ve added a new sidebar menu (highlighted in green in the image below) in the Metrics Drilldown app to help you more easily hone in on specific metrics.
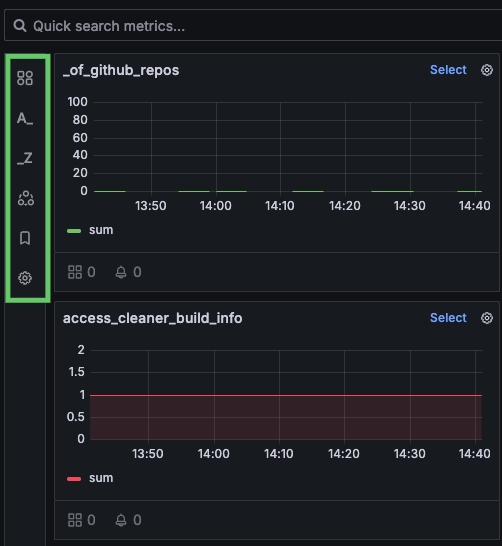
This sidebar is collapsible, allowing you to focus on the data that matters most by providing more screen real estate for filtering. You can filter by the prefix and suffix of metric names, leveraging the organizational power of metric naming conventions. Prefixes often categorize metrics, while suffixes typically indicate the unit of measurement, such as _seconds for a duration-related metric or _bytes for a storage metric.
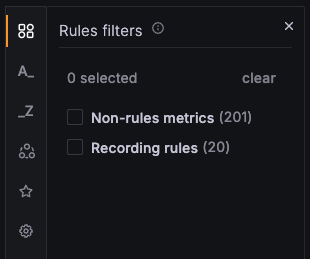
As you select these filters, you’ll see real-time updates to the metric counts, giving you immediate feedback on the impact of your selections. You can also filter by rules, including recording rules and non-rules metrics.
Overall, the new sidebar and filtering functionality allow you to refine your search and more precisely target the data you’re looking for.
Group by labels to more effectively organize metrics
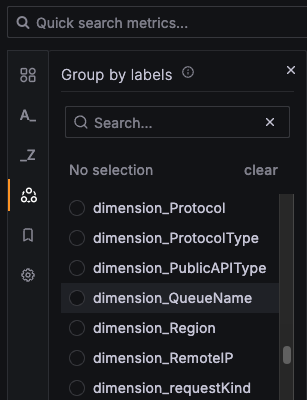
Another feature we’ve recently added to Metrics Drilldown is Group by labels. This allows you to group metrics by specific label names, making it easier to identify patterns and anomalies. For example, you may want to see metrics associated with specific labels, such as k8s_container_name, when you want to narrow down the problem scope and determine if an issue is affecting one container or another. With this new group-by functionality, you can quickly pinpoint the metrics that are specific to your domain.
You can add these label values directly to your filters for further refinement. For those working with large datasets, we’ve also added pagination to panels with extensive metric groups.
Tailor your view with more intuitive sorting
By default, metrics are sorted alphabetically, with recently selected metrics shown at the top. However, you can now also sort metrics based on their associated dashboards and related alerts. This helps you quickly identify metrics that are actively monitored or tied to critical alerts, so you can investigate issues more efficiently and prioritize looking at metrics that are used most heavily.

Get started today
With these new Metrics Drilldown features, we’ve made it simpler, faster, and more intuitive to uncover the insights you need. Imagine you’re an SRE investigating latency issues. You can start by filtering out non-rules metrics, then narrow down by prefixes and suffixes, group by labels, and, finally, sort by usage — these features are designed to work together seamlessly.
We hope you’ll give them a try today and let us know what you think! You can learn more about Metrics Drilldown in our technical documentation, and also explore a demo first hand in Grafana Play.
Grafana Cloud is the easiest way to get started with metrics, logs, traces, dashboards, and more. We have a generous forever-free tier and plans for every use case. Sign up for free now!


